The terrain sets the starting point, but the grading method sets most of the volume. Every method is solving for something: piles inside their reveal band, tracker ends that line up, ground that a pile-driving rig can work on. Each of those has a price in cubic metres, and a volume looks high when you are paying for something you do not need, or when nobody has put the alternatives side by side.
This page walks through two sites from two of our customers. Each was graded two ways in PVX.Cad inside AutoCAD, on the same layout and the same terrain. Every number below is from the drawing: the cut/fill totals, the sections and the slope tables.
| Site | Method | Cut (m³) | Fill (m³) | Total moved (m³) | Net |
|---|---|---|---|---|---|
| Tracker, 24.9 ha | Pile-based grading | 4,438 | 5,250 | 9,688 | 812 m³ to bring in |
| Tracker, 24.9 ha | Adaptive pad grading | 12,438 | 5,989 | 18,427 | 6,448 m³ to haul out |
| Fixed tilt, 69.7 ha | Terrain smoothing and adapting | 53,135 | 34,211 | 87,346 | 18,924 m³ to haul out |
| Fixed tilt, 69.7 ha | Fixed pad grading | 61,062 | 49,602 | 110,664 | 11,460 m³ to haul out |
Neither site has a wrong answer in this table. Each row is the right answer to a different question.
What grading can be asked to do
Before comparing volumes, write down what the grading has to achieve on your site. In practice it is some mix of three things:
- Keep every pile inside its reveal band. The structure needs a minimum clearance and a maximum pile length. This is the minimum any grading has to do.
- Line up neighbouring tables. On trackers, the end of one table and the start of the next should sit at about the same height. A step between them means the higher end shades the lower table.
- Leave ground that machinery can work on. Pile drivers, mounting crews and maintenance vehicles need ground they can stand and travel on. Some EPCs set this as a hard requirement.
The first is always needed. The second and third depend on the project, and each one adds earthwork.
Site 1: a 24.9 ha tracker site
The terrain is moderate. 39% of the area is steeper than 12%, and almost none is steeper than 24%.
First run: pile-based grading, 9,688 m³
Pile-based grading reshapes the ground under each tracker as one continuous surface along that tracker, just enough to keep its piles inside the band. In the sections, pile reveals run from 1.26 m to 2.3 m and the graded line follows the natural ground closely.

The result is 4,438 m³ of cut and 5,250 m³ of fill: 389 m³ per hectare, almost balanced, with 812 m³ to bring in. On volume alone this is the answer.
Look at the joint
Each tracker is graded on its own, so nothing ties the end of one tracker to the start of the next. In section 145-145’, the first tracker ends on a 2.1 m pile and the next one starts higher, on a 2.29 m pile, with a +14.8% ramp and a 17.8 m² fill wedge between them. The same step shows in every section on this pair of trackers.
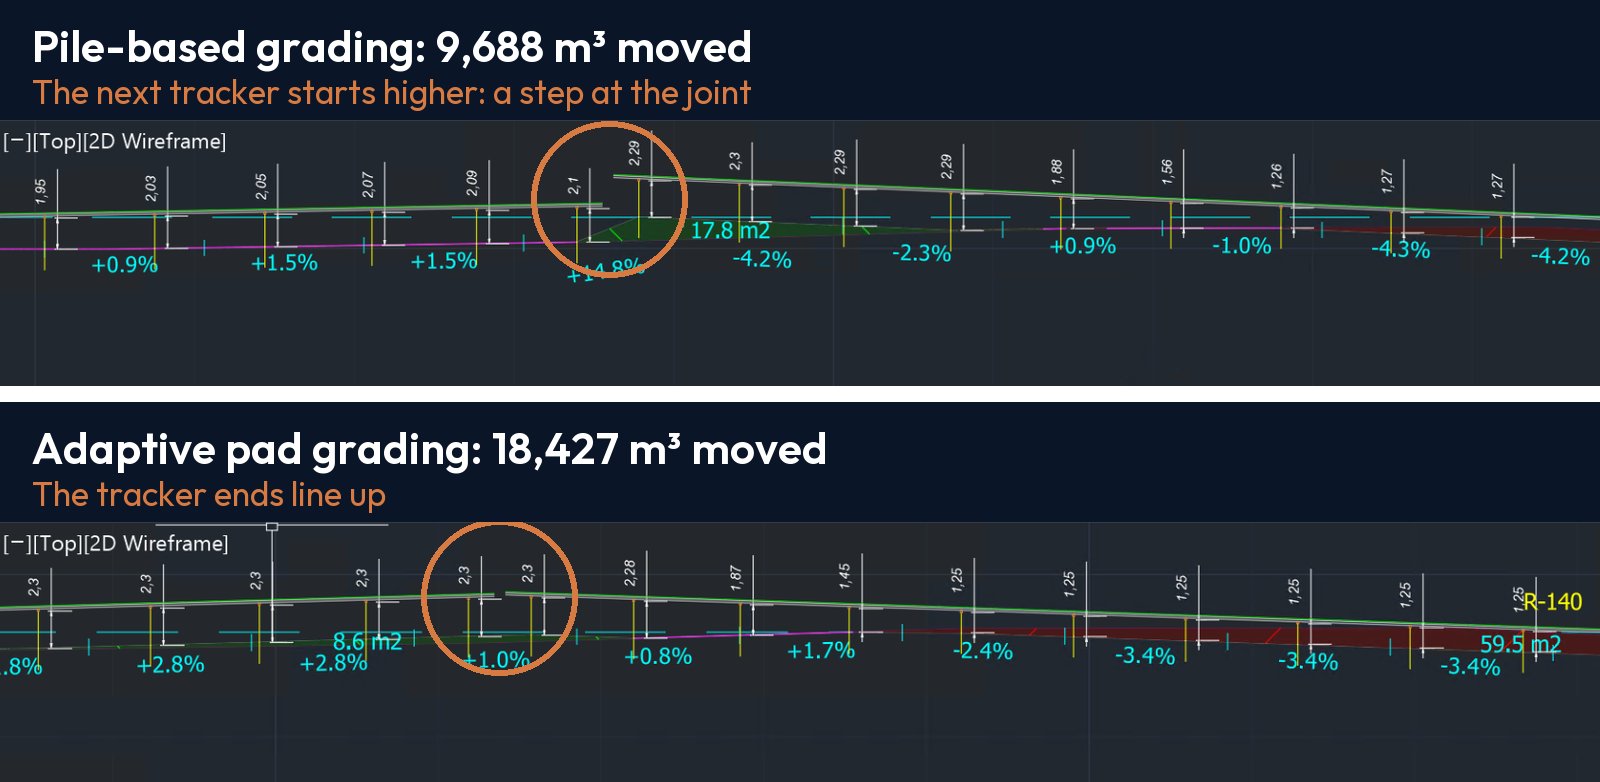
A step like this shades the lower end of the neighbouring tracker. Whether it matters depends on its height and on what your energy model says it costs. A few centimetres may be acceptable. A step repeated across hundreds of joints is a yield loss for the life of the plant.
Second run: adaptive pad grading, 18,427 m³
Adaptive pad grading cuts a level pad under each table and levels the tables that meet end to end as one row, so the joints line up. In the sections, both piles at the joint are at 2.3 m and the two tables meet at the same height.

The price is 12,438 m³ of cut and 5,989 m³ of fill: 740 m³ per hectare, 8,739 m³ more than the first run. The balance changes too: instead of bringing in 812 m³, you now have 6,448 m³ of surplus cut to haul out or spread.
The trade-off on this site
Pricing the extra 8,739 m³, and the haul, against the shading loss from the steps is a calculation you can do with your own earthwork rates and your own yield model. If the steps are small, the first run is the better design. If they cost energy every day, the second run pays for itself. You can also mix them, levelling only the rows where the step is large.
Site 2: a 69.7 ha fixed-tilt site
This terrain is steeper. 44% of the area is steeper than 12%, and 8.3% is steeper than 24%.
First run: terrain smoothing and adapting, 87,346 m³
Terrain smoothing brings the ground within the structure’s slope limits as a continuous surface. The tables are then adapted to that surface, so most of them follow the slope instead of being cut into it.
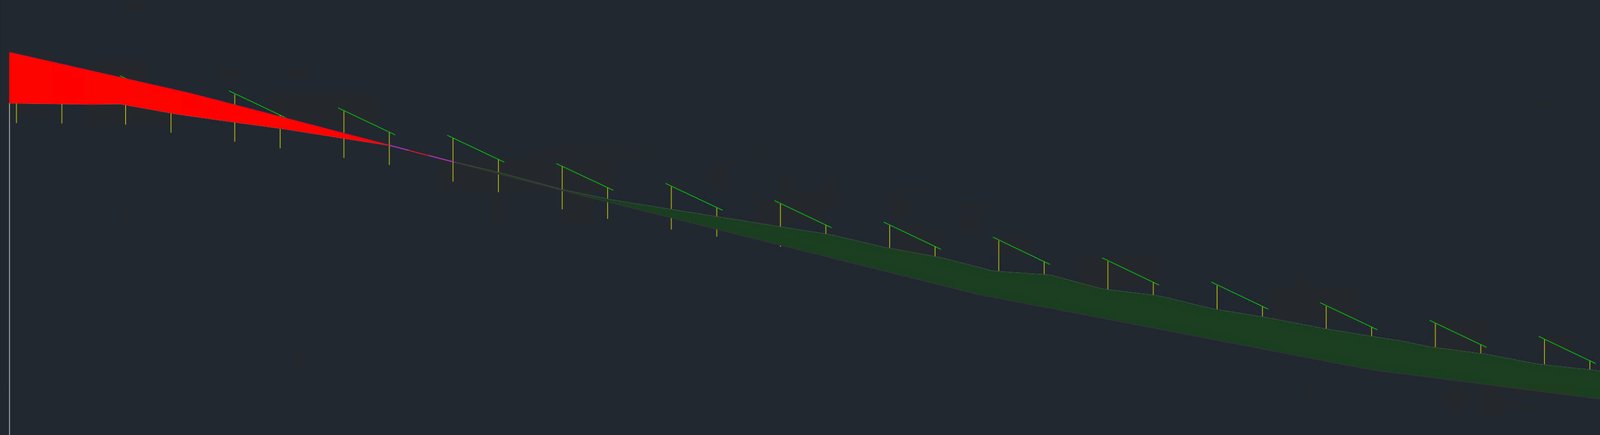
The result is 53,135 m³ of cut and 34,211 m³ of fill, 1,254 m³ per hectare. The section shows where the volume goes: a deep cut at the top of the slope and a long fill wedge down the hill.
The customer’s requirement
The customer came back with one requirement: they make the ground flat where the tables stand so that crews can use machinery there. A pile-driving rig cannot move on terrain that is too steep, and on this hillside much of the smoothed ground still was.
Second run: fixed pad grading, 110,664 m³
Fixed pad grading cuts a level bench under each table and leaves a slope between benches. In the section the hillside becomes a series of steps, each table on its own pad.
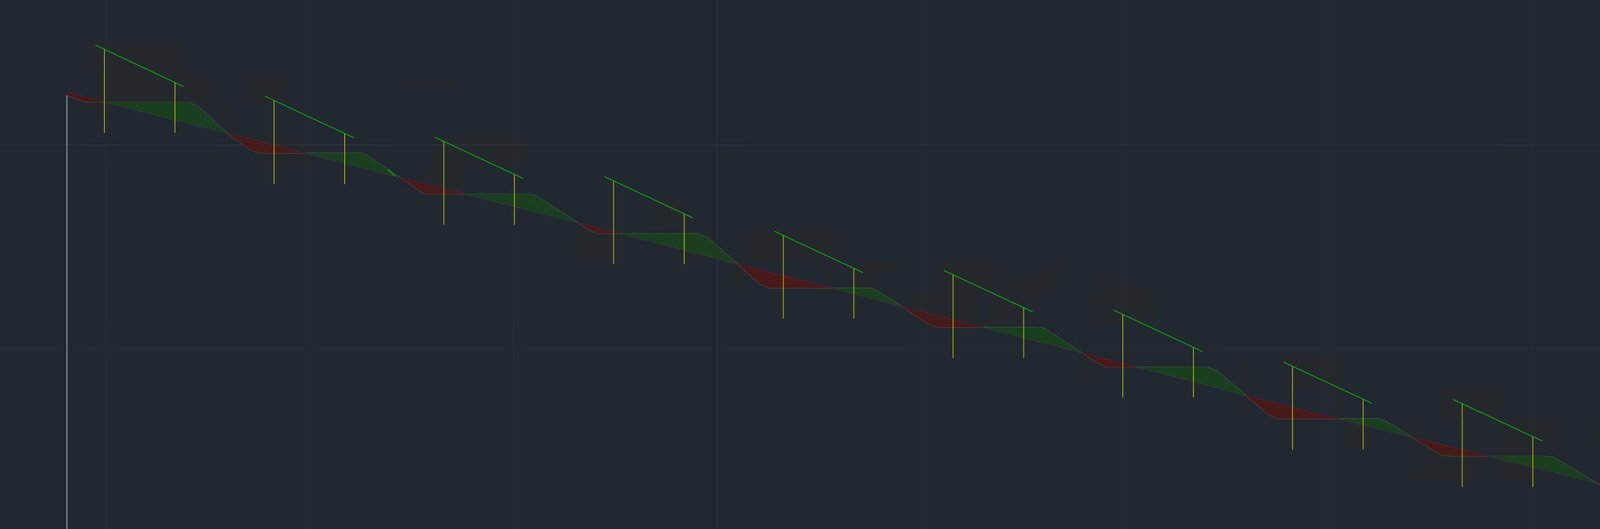
This costs 61,062 m³ of cut and 49,602 m³ of fill, 1,589 m³ per hectare, which is 23,318 m³ (27%) more than the first run. The balance improves: cut and fill offset each other on every bench, so the surplus to haul out drops from 18,924 m³ to 11,460 m³.
The trade-off on this site
The extra earthwork buys a site the customer’s crews can build the way they work. Total volume favours the first run, haulage favours the second. When the rig cannot work on the slope, the first run is not an option, and the extra 23,318 m³ is the price of building the site at all.
Read the slope table, not only the totals
Every grading run in PVX.Cad writes a slope analysis table: how much of the area falls in each slope band before grading (Original), after smoothing (Smooth), and after the tables are adapted (Corrected).
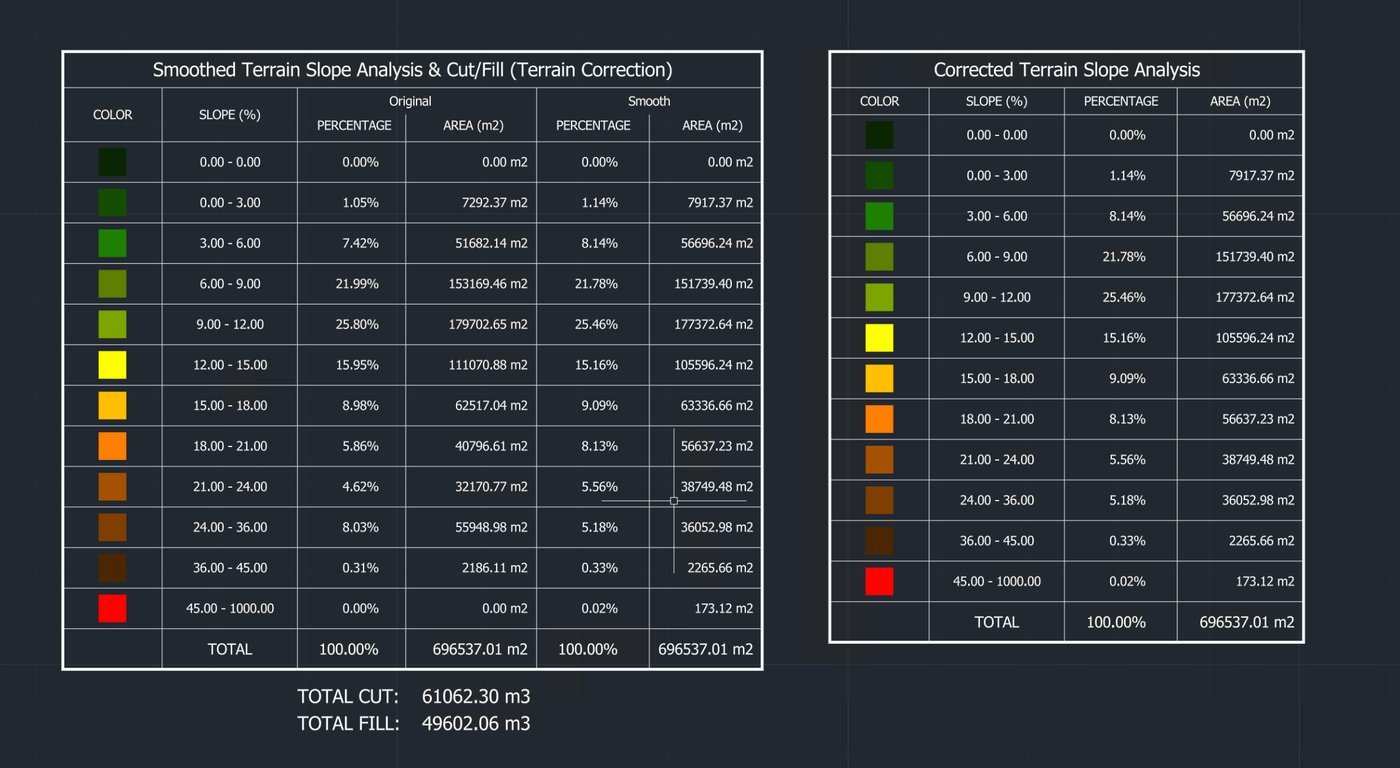
The table shows where grading made the ground steeper. On the fixed-tilt site the original terrain had nothing steeper than 45%. After either run, about 175 m² is: batters and cut faces created by the grading. On the tracker site, pile-based grading created 90 m² between 36% and 45% where the original had none: the ramps at the tracker joints. These are small areas, but they are exactly where erosion starts and where a vehicle cannot go. Find them on the map before the earthworks contractor does.
Five checks for any grading design
These work on any grading output, from any tool, including a design you received from someone else.
- Total and net. Add cut and fill for the total moved, and subtract them for what has to be hauled in or out. Apply your own swell and shrinkage factors before you price the haul.
- Volume per hectare. It lets you compare sites and methods of different sizes. Here it ranged from 389 to 1,589 m³ per hectare.
- Sections at the joints. Cut a section along a tracker row through at least one joint and look at the step between neighbouring tables.
- The steep bands after grading. Compare the slope table before and after. Any area that got steeper is a batter or a ramp: check erosion and access there.
- Construction constraints, written down. Ask the EPC whether the pile rig, the cleaning equipment or the maintenance vehicles need level ground, before you choose the method.
If you cannot answer one of these from the design you have, that is the question to send back.
How to run the comparison in PVX.Cad
Run each method on the same layout, keep the tables, and compare.
- Area grading (Earthworks panel, Grading): smooths a whole PV area to N-S and E-W slope limits, with a cut/fill balance slider. Turn on Show Slope Analyzer for the slope table and Show Cut/Fill Map for the colour map.
- Pad grading (Layout, Collision Analysis, Adapt Terrain to Pile): cuts a level pad under each table. On trackers it levels tables that meet end to end as one row so the joints line up. On fixed tables, Grade + Adapt together grades and seats the tables in one run.
- Targeted terrain adaptation (Collision Analysis, Fix collisions): regrades only the racks that miss their pile reveal band, as one continuous surface along each rack, and holds the rest of the site.
- Row Adjustment (Collision Analysis, trackers): levels rows of tables already placed against the tables they meet end to end, and reports the worst and mean joint step before and after.
Note the totals and the slope table after each run, so the methods can be compared on the same five checks.
Try it on your own terrain
The two-week trial is self-serve: create your account at id.pvx.ai, install PVX.Cad on your own AutoCAD, import your terrain, and grade the same layout two ways.
- Start the two-week trial
- Book a demo to go through your site’s grading options with one of our engineers.
- Related: Three grading approaches compared and Why tracker architecture is becoming an earthworks decision.